Twitter Analytics became available to all users in late 2014. Despite being around for three years, it is still largely underutilized by marketers. I personally find Twitter Analytics to be highly valuable and wanted to share the key metrics I evaluate using it.
 Where is Twitter Analytics?
 Where is Twitter Analytics?
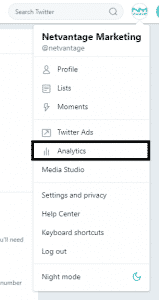
Anyone with a Twitter account can access analytics. Click on your profile picture in the upper right-hand corner of Twitter and select Analytics via the drop-down menu. It can also be accessed via direct URL, analytics.twitter.com; login to your account if necessary and you’ll be taken to your main dashboard.
What Can Twitter Analytics Show Me?
Twitter Analytics will show you data that you’ve likely been getting elsewhere for years now. Prior to Twitter Analytics, I would use Sprout Social, which is still true, but Twitter Analytics provides me with new data I can’t get elsewhere. Below I break-down the main tabs in Twitter Analytics and which metrics to look at when you’re short on time.
Home
The Home tab gives you a nice 28-day overview of how your tweets are performing compared to the previous period. The tab shares the number of tweets you’ve sent out over that time period, as well as how many impressions those tweets have received. The dashboard continues with stats on the number of times your profile has been viewed, mentions and the number of followers.
Next, the home tab breaks up data by month. For each month, it highlights the top tweet, again in terms of impressions; the top mention, in terms of engagements; your top new follower and more. Highlighting the top tweet each month can help you learn what resonates with your audience the most. Additionally, the monthly breakdown shares the top mention of the month. This metric can help determine users to engage with on a regular basis.
Key Metric: Tweet impressions compared to the previous period. It will help determine if your tweets are reaching your audience.
Tweets
The Tweets tab starts with a graph that shows impressions and the number of tweets sent each day over a 28-day period. It’s a great overview before diving into individual tweets’ performances.

Below the graph is a table that shares the number of impressions, engagements and engagement rate for each tweet. Clicking on a tweet in the table provides slightly more information by breaking down the type of engagements for the tweet. The table has different view options too. The first option includes the tweets you sent out over 28-days. The second highlights your top tweets during that period. The third includes tweets and the replies you sent. Lastly, the table has an option for just promoted tweets.
Additionally, the Tweets tab has 28-day period graphs and averages for engagement rate, link clicks, retweets, likes and replies.
Key Metric: Top Tweets. Looking at this tab will provide you insights on the type of tweets your audience is connecting with.
Audience
The Audience tab provides you with a lot of information you likely can’t get elsewhere. The first screen of the tab is an overview and provides you with a glimpse of data that can be found in the subsections of the Audience tab. Viewing each subsection gives you the ability to learn more about your audience.
The Demographics section of the Audience tab offers basic data such as age, gender, and country. It also gives you additional insights about followers’ home ownership & value and household income.
The Lifestyle section shares data on your followers’ interests. With Netvantage being in the online marketing field, it isn’t a surprise that our followers’ interests are technology, marketing, etc. The section also has information regarding political party affiliation and the type of TV your followers watch.

The Consumer Behavior section includes data from Datalogix (a Twitter partner) and is only available for the U.S. It provides insights on the buying preference of your audience. Twitter, or Datalogix, also knows what you tend to buy at the grocery store…

Lastly, the Mobile Footprint section has data on the wireless carrier your followers. Additionally, this section has insights on the type of device your followers are using to view Twitter, even if they aren’t using a mobile device.
Key Metric: Interests. Knowing your audiences’ interests can help you determine what type of information they are seeking from Twitter.
These three tabs are just the start of what you can learn from Twitter Analytics. Take some time to explore Twitter’s free tool and learn more about your audience to improve your social media strategy!
Leave a Reply