Recently, we’ve been getting a decent number of requests from clients to see specific Google Analytics (GA) data put into some kind of easily digestible table-like format and updated on a regular basis. We could do all of that by hand but why waste time manually updating spreadsheets when the data is repetitive and can be gathered, tabulated, formatted and displayed via relatively easy scripts? Anyone who reads our posts with any regularity knows that these kinds of situations fall squarely on my shoulders.
To start let’s talk about the things you’ll need to have in place.
- Website with GA installed and tracking site statistics.
- Ummm…. That’s about it ’cause if you’ve got that, you’ve got everything else you need.
Let’s Get Crackin’
My initial plan was to lead you through the steps of creating your own dashboard. But I usually find it a whole lot easier to take a look at what someone else has done and then modify their work to fit my needs. So here’s a link to a Google Sheet that I’ve created which is a Sample Analytics Report. This one is read-only but under the “File” menu you can make a copy and then edit to your heart’s content.
The spreadsheet linked above already has the Google Analytics add-on installed. However, if you do plan to make a new sheet from scratch, please note that you will need to install the “Google Analytics Add-on” from the add-ons group on the menu bar.
If you use GA with any regularity you will probably understand the summary tab right off the bat–it doesn’t take rocket appliances. Let’s focus on the blue Report Configuration tab. Let’s step through the options…
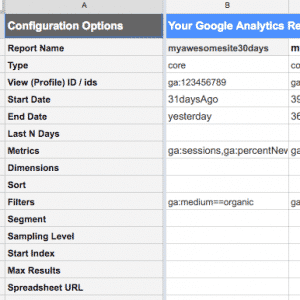
- Report Name: Can be anything but blank. There will be a new tab in this sheet created with that name and the requested data.
- Type: Just leave it at “core.”
- View (Profile) ID / ids: Your GA profile ID. To find it, open GA, use the main (very top) navigation to go to “Admin,” select the appropriate account, property, & view, in the “View” column on the far right, click the first link which is “View Settings.” Your ID will be the first thing there under View ID. Analytics will only give you the ID number–you will have to change it to the format “ga:###########” when you put it into the spreadsheet.
- Start Date: The starting date for the data gathering. It can be an absolute date like 3/24/2016 or a relative date like you see above–31daysAgo. (More on this via the link below.)
- End Date: Same as Start Date but for the end of the report data.
- Last N Days: Instead of…not in addition to…specifying the start and end dates for your analytics report, you can simply put something like “30” into this field and get the last 30 days of data.
- Metrics: These are the high-level independent data points that can be accessed. This includes things like sessions, new users, bounce rates, page views, etc. We are using these metrics: ga:sessions, ga:percentNewSessions, ga:newUsers, ga:bounceRate, ga:pageviewsPerSession, ga:avgSessionDuration.
- Dimensions: These are the lower-level dependent data points that modify the “metrics.” For example, session duration is a dimension. The concept of session duration doesn’t mean anything without the metric of session.
- Sort: If you need to order the data ascending or descending, this is the place to do it.
- Filters: These will restrict the data you’ve requested in metrics and dimensions. Notice that we have an “organic” filter set up because we only want to see organic traffic.
- All the Rest: These options perform various levels of magic. We won’t go into all that here because I wouldn’t finish typing until we’re both old and grey.*
*I’m already old and grey.
You can find more detail on the spreadsheet add-on here: https://developers.google.com/analytics/solutions/google-analytics-spreadsheet-add-on
You can find a very helpful interactive list of metrics and dimensions here: https://developers.google.com/analytics/devguides/reporting/core/dimsmets
Now What?
Now play around. First, change the Profile ID to match your site’s profile ID. After that, you can actually run the report by clicking Add-ons >> Google Analytics >> Run Report and it should work fine and pull your website data based on the requests that I’ve placed in this configuration table. Try it!
When you run the report, it will create a new tab for each column in the configuration table. The new tabs will contain data similar to this.
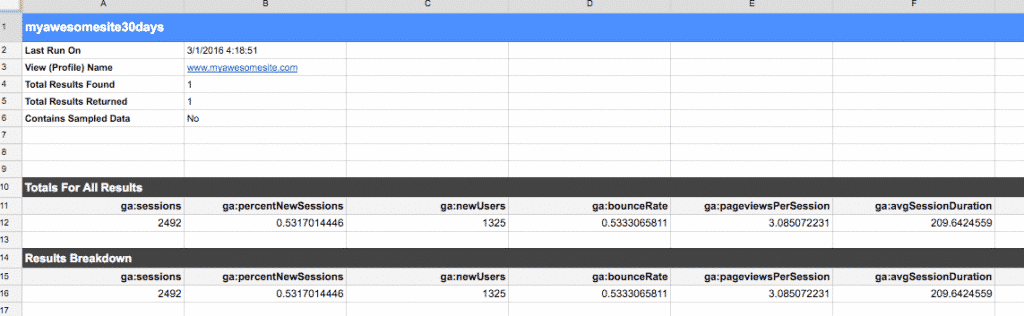
Obviously, that’s the raw data and it isn’t very helpful by itself. Once you start running 3 or 4 or 20 tabs’ worth of data and roll it all up into a summary table, then you can see how useful this can be. Here’s the summary table from our spreadsheet.
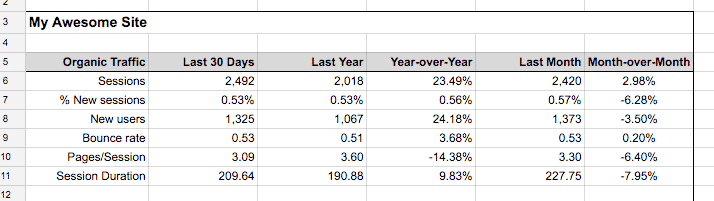
If you look at the spreadsheet itself you’ll also notice Keyword Rankings and Notes on our summary tab. Those are both manually entered at the moment. We’re considering automating them in the future and if we do you can bet I’ll blog about it.
How To Make It Really Useful
What I’ve given you is great but let me tell you how we use this tool. We need to look at hundreds of sites’ worth of analytics data quickly and make determinations on actions to take for clients. If we had to look in each GA account separately it would take a year to sort through. So…on the report configuration tab, we have multiple clients set up. We simply start adding more columns to the right of what you see in this example sheet. Each client gets 3 columns–30 day data, year-over-year data, and month-over-month data. Each set of 3 columns repeats over and over. The only thing that changes is the “Report Name” cell and the “Profile ID” cell.
Also, we have the reports automatically scheduled to run periodically** so the data is always fresh. In the end, we have multiple clients with multiple data tables all automatically updated and summarized on one single spreadsheet. Talk about a time saver!
** Click Add-ons >> Google Analytics >> Schedule Reports to do this.
We don’t incorporate graphs or charts into our summary page but that is something that many people do and appreciate. Experiment with that to add some color and readability to the bland numbers.
Pro Tips
Sharing the spreadsheet… Once you create all this–specifically if you create something cool for one client–share it with them by clicking File >> Share… You can give the client (or any other party) “view” or “edit” permissions accordingly and then everyone can see the same automatically updated information at the same time.
Creating a master dashboard… If you start pulling too much data into Google Sheets you can run out of cells in the sheet. I believe the cap is around 2,000,000 and that might sound like a lot but we’ve hit that cap a bunch of times. (I’m not sure how Google counts the 2M cells but I think their math is wonky.) To have your pie and eat it too, create multiple spreadsheet files. Create as many files as you need to pull all of your GA data and then create one “Master Dashboard” file that rolls it all up, performs final calculations, and displays the whole mess. Google’s ImportRange function is invaluable here and there are many tutorials out there to step you through the process.
The End
I think that’s it. My fingers are numb, my brain is fried, and I doubt you’ve had the stamina to read this far anyway. Thank you if you have. Use the comments below to hit me up with questions if you have any. Good luck!
Leave a Reply